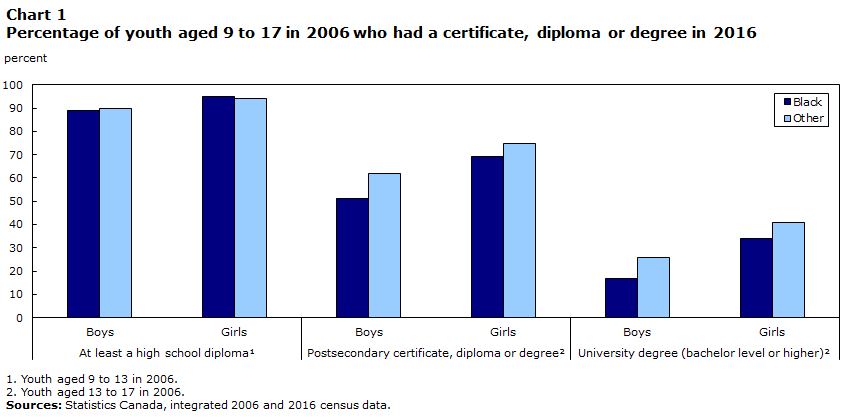
The above chart shows the percentage of Black (dark blue) and non-Black (light blue) Canadian youth, aged 9 to 17 in 2006, who ten years later held a high school diploma (left bars), a post-secondary credential (middle bars), or a university degree (right bars). The data is further demarcated with separate bars for males and females.
Below is an excerpt from the Statistics Canada
commentary which accompanies the above chart:
"Most Canadian youth graduate from high school, and many of them then pursue postsecondary education. However, youth who do not obtain a high school diploma often have difficulty with labour market integration and have higher unemployment rates and much lower employment income.
Among Canadian youth who were aged 9 to 13 in 2006, just over 9 in 10 had at least a high school diploma 10 years later. For both Black youth and other youth, women were more likely than men to have at least a high school diploma. However, there were no significant differences in high school completion rates between Black youth and the rest of the population…
…The situation was different for completion of a postsecondary certificate, diploma or degree, which includes a registered apprenticeship or other trades certificate or diploma; a college, CEGEP or other non-university certificate or diploma; or a university certificate, diploma or degree.
Black youth were less likely than other youth to attain a postsecondary qualification. For example, among Black boys aged 13 to 17 in 2006, approximately half (51%) had a postsecondary qualification in 2016 (when they were aged 23 to 27), compared with 62% of other boys.
Young Black women were more likely than young Black men to have completed postsecondary studies. However, they were less likely than other women in the same cohort to have a postsecondary certificate, diploma or degree in 2016. For example, 34% of Black girls aged 13 to 17 in 2006 had a university degree 10 years later, compared with 41% of other girls from the same cohort."
Imagine if instead of the separated out data above, the above chart instead only had three bars showing the percentage of
all youth who held the three levels of credentials. In other words, imagine there was no separating out of the data for Black and non-Black youth or males and females.
Such a simplified graph would capture the overall percentage of Canadian youth who had graduated high school, college, and university, but it would say nothing about the differences in educational attainment between Black and non-Black youth or males and females.
That additional information is critical for governments (and other educational stakeholders) in making policy decisions about how best to tailor educational services to the needs of specific groups. This is in the interests of ensuring
educational equity - ensuring
fairness and
inclusion for all social groups. (
♾)
For example, the disparity between Black and non-Black youth in post-secondary educational attainment (which the above chart shows) could lead to changes in admissions policies or greater recruitment outreach to Black youth (and other under-represented populations).
Hence, the significance of the final phrase in the quote at the top of this topic page: "It is the differences among these groups that often fuels education policy debates about the distribution of education subsidies and services."